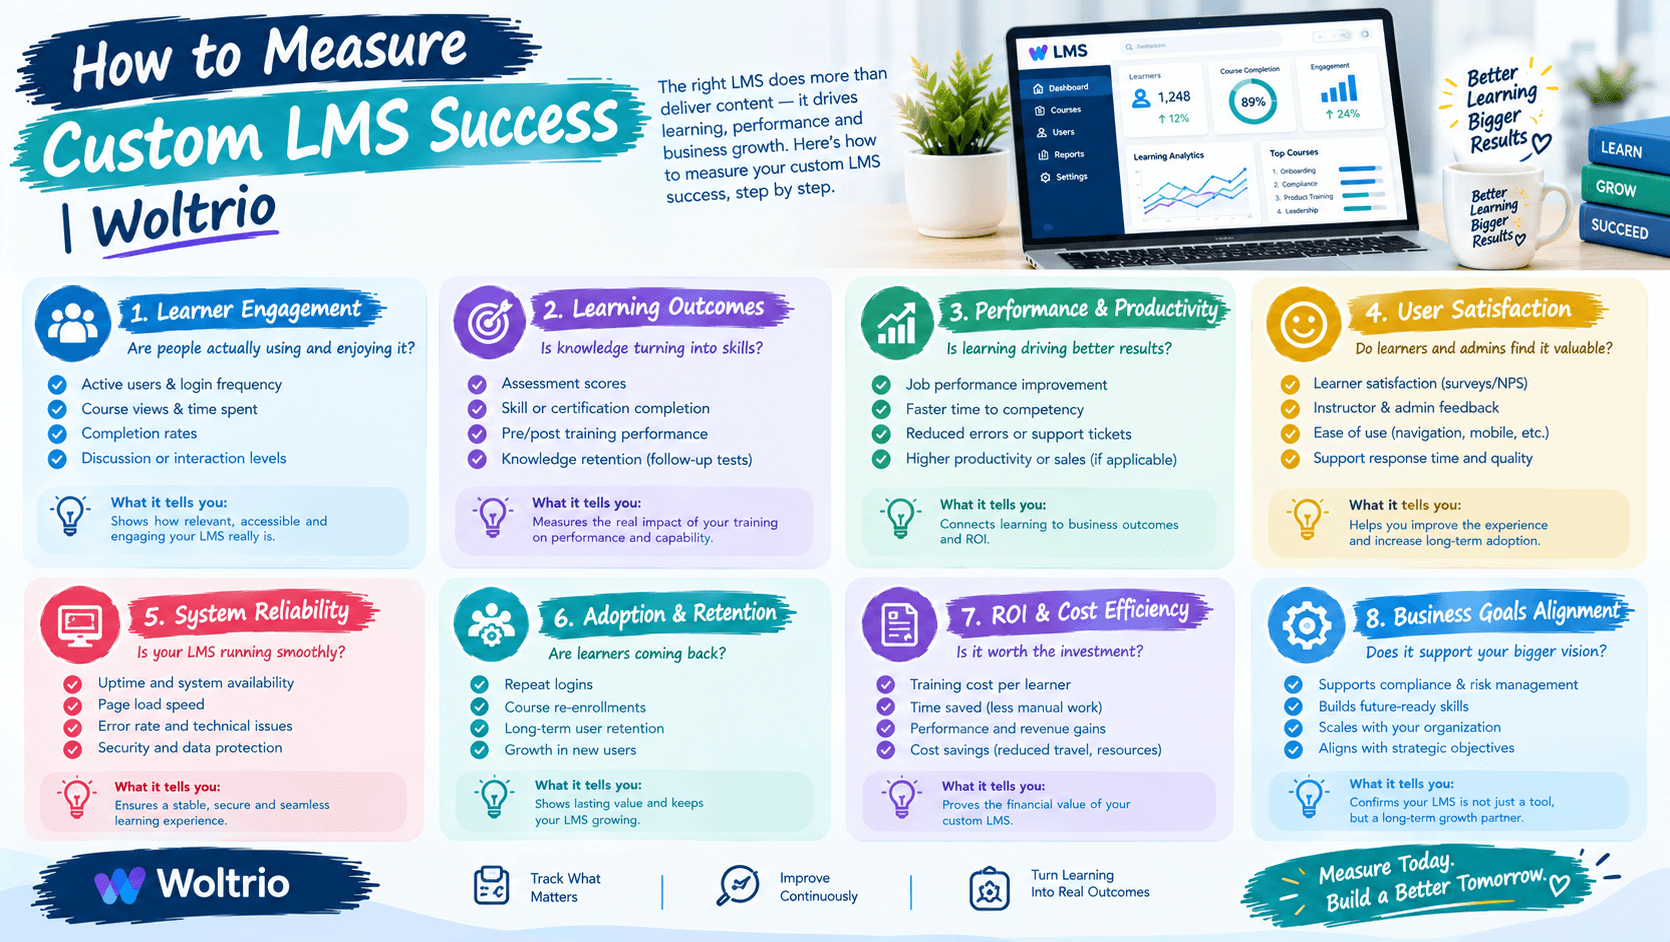
Launching a custom LMS is not the finish line. Six months later, someone senior will ask whether it was worth it, and “staff seem to like it” is not an answer. This guide covers seven metrics that give you a real one, plus how to read them and what to do when a number looks wrong.
Why Measurement Needs a Baseline
You can only show improvement if you know where you started. Before launch, record the current numbers for the metrics below, even if they come from a spreadsheet or a rough estimate. A rough baseline beats none. Woltrio asks for this during discovery, because it also tells us which problems the project must solve first.
Metric 1: On-Time Completion Rate
Track the share of assigned training finished before its deadline, not just the share finished eventually. A system can show a high overall completion rate while most people finish late.
How to read it: Break it down by department and location. One weak group usually points to a local cause, such as a manager who never reminds anyone, rather than a platform problem.
Metric 2: Time From Hire to First Assignment
Measure the gap between a new hire’s start date and the moment their onboarding path appears. In a well-integrated system this is close to zero, because HR data triggers assignment automatically.
How to read it: A gap of several days means assignment is still manual or the HR sync is delayed. This is the clearest test of whether integration work paid off.
Metric 3: Certification Lapse Rate
Count how many certifications expired before renewal. The goal is zero, and every lapse deserves a root cause.
How to read it: If lapses cluster around one role, the renewal rules for that role may be modeled wrongly. If they are scattered, check whether reminders are reaching the right people early enough.
Metric 4: Time to Produce a Compliance Report
Time how long it takes to produce an audit ready report from request to delivery. Before launch, this might take hours of manual reconciliation. After a good build, it should take minutes.
How to read it: If it is still slow, the problem is usually the data layer, not the report screen. Clean completion records are what make fast reporting possible.
Metric 5: Administrator Hours Per Month
Estimate how many hours training managers and administrators spend on manual assignment, chasing reminders, and rebuilding reports. This is the cost that never appears on an invoice.
How to read it: A drop here is often the strongest financial argument for the project. It is also where scoped AI and automation shows its value, since automated reminders and escalations take over work people used to do by hand.
Metric 6: Learner Friction Signals
Look for signs that staff struggle with the system itself: login problems, help requests, abandoned modules, and how long a typical module takes to start. Short pulse surveys of two or three questions work well here.
How to read it: High abandonment on specific screens points to design problems. This is why Woltrio’s UI/UX design process continues to use learner feedback after launch, not just before it.
Metric 7: Support Tickets Related to the LMS
Track IT tickets about logins, sync failures, and missing assignments. A healthy system sees these fall steadily after the first few weeks.
How to read it: A persistent cluster of sync tickets suggests the HR or identity integration needs another look. A spike right after launch is normal and should settle quickly.
A Simple Scorecard
MetricBefore Launch90 Days AfterTarget DirectionOn-time completion rateRecord baselineMeasureUpHire to first assignmentRecord baselineMeasureDown to near zeroCertification lapsesRecord baselineMeasureDown to zeroTime to produce a compliance reportRecord baselineMeasureDown sharplyAdmin hours per monthRecord baselineMeasureDownLearner friction signalsRecord baselineMeasureDownLMS related support ticketsRecord baselineMeasureDown after launch spike
Review the scorecard at 30, 90, and 180 days. Early numbers show whether the foundation works. Later numbers show whether habits have changed.
What to Do When a Number Looks Wrong
Resist the urge to blame users first. A weak metric usually traces back to one layer of the system: identity, data sync, assignment logic, reporting, or interface. Find which layer owns the problem and fix that layer. A pilot approach helps here, since MVP development lets you test a fix on one workflow before changing the whole system.
Keep Compliance Metrics Honest
If your LMS holds staff records or sensitive adjacent data, add a quarterly check that access controls, audit trails, and encryption are working as designed. Woltrio builds HIPAA, SOC 2, and GDPR requirements, where relevant, into the architecture from the start, but ongoing review keeps them true as the organization changes.
Quick Answers
On-time completion is a better measure than overall completion, because late training still creates risk.
Time from hire to first assignment is the fastest test of whether HR integration works.
Certification lapses should trend toward zero, and each one deserves a root cause.
Time to produce a compliance report shows whether the data layer is clean.
A baseline taken before launch is what makes every later improvement provable.
Common Questions
When should we first review LMS success metrics?
Check early signals at 30 days, then review the full scorecard at 90 and 180 days once habits have settled.
What if we did not record a baseline before launch?
Reconstruct a rough one from old spreadsheets, support tickets, and staff estimates. An approximate baseline still lets you show direction.
Which single metric matters most?
It depends on your goal, but time to produce a compliance report and certification lapse rate matter most in regulated environments.
Next Step
A discovery conversation through the Woltrio homepage is a practical way to set your baseline and choose the right success metrics before development begins.